Onboarding Redesign
Key Problem
Only 6% of customers who created an account were completing onboarding and making a deposit onto Stash. And from our diary study, we discovered that:
Customers were not comfortable signing up for a free trial before seeing what the Stash app looked like or being able to explore the features on their own.
After signing up, customers were not sure what steps to take next to get started.
Objective: Design an onboarding that is more aligned to our customer’s expectations
Team
I was a senior UX researcher at Stash, during which I worked on the new user investing experience. As the sole researcher on this project, I collaborated with several product teams, working particularly closely with 4 designers, 4 product managers, 2 engineering leads, and our growth marketing lead.
Process
With a set of customer pains in mind, we to further define the problem area with the aim of developing two or three diverging onboarding patterns that we could test with customers.
Step 1: Heuristic Analysis of our existing flow
While we were able to observe customers experiencing issues or bugs in our onboarding, I felt it was important to have a comprehensive analysis of our onboarding to identify key areas of improvement. I tested all three of the our experiences myself (Web, Android, and iOS) and shared the results in a FigJam. I also assigned one flow to each of my stakeholders and ask them to share their own experiences in the FigJam as well, grading their experience with our internal grading rubric shown below.

Step 2: Competitive Analysis
Having looked at our own experience and noting areas of improvement, I felt the next best thing to do would be to see how some of our competitors with similar products have customers sign up. I put together another FigJam with 7 different onboarding experiences and ran a series of workshops with my stakeholders where we identified key moments in the experiences and where those flows were addressing problems we know our customers face.

Step 3: Ideation and Testing
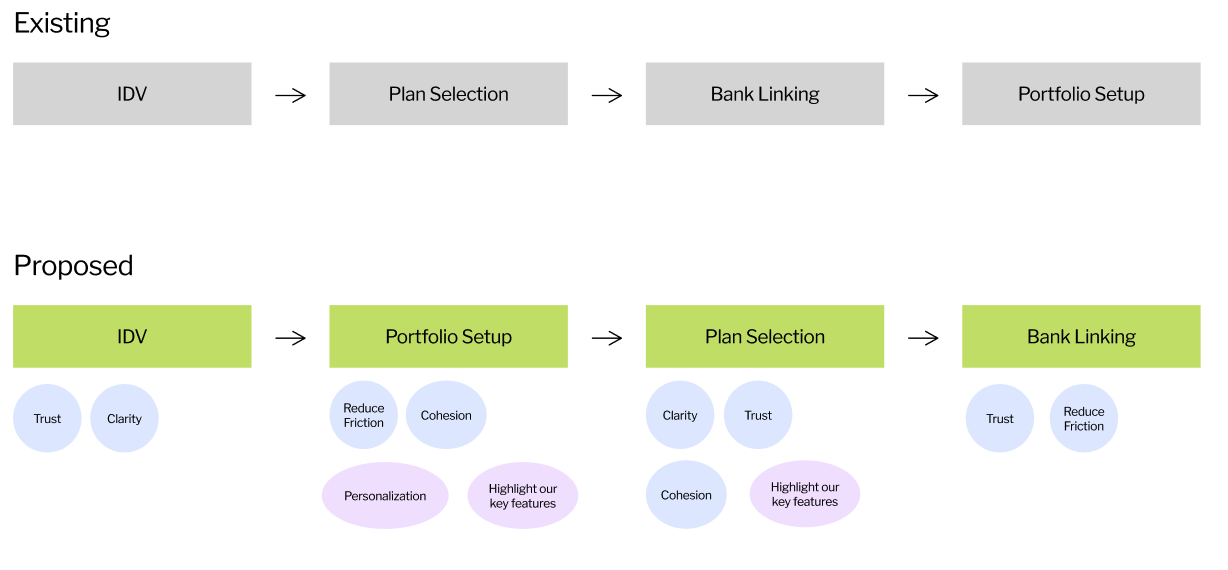
Knowing where our own onboarding was falling short paired with a knowledge of other real-world examples, we developed a hypothesis to ideate on:
A simpler and more personalized onboarding will lead to more trust and higher deposit rates.
From there, I worked with our design team to develop a pair of onboarding designs that explored this hypothesis.
Additionally, I developed a research approach that would allow the 4 teams to work concurrently without slowing down additional design work on small fixes and bugs that we’d discovered previously.
Phase 1: I proposed testing our most novel design first to allow us to test it again once the full design was complete. The first test was an unmoderated prototype test (n=12).
Phase 2: We tested the entire design with an update to our most novel design in a moderated test (n=8).
Overall research time: 3 weeks + 1 week for recruiting.
Step 4: Research and Results
Phase 1: I created a task list aimed at understanding if the prototype met user expectations and to ask customers to evaluate the prototype against a list of objectives we’d developed for each experience. At the end I summarized the findings in a scorecard, along with specific insights for each segment of the flow.

Phase 2: After making updates to the design based on user feedback, we put the entire flow together and brought it to 8 participants in a moderated test. Stakeholders were invited to attend broadcasts of each interview and suggest additional questions or comment on feedback. Afterward, I once again summarized the findings into a scorecard with deeper analysis for each part of the experience.


Step 5: Build and Monitor
Once the design was built, I built a series of in-product surveys to monitor if our experience was meeting customer expectations. I installed 3 ease-of-use surveys that measured how easy it was for a user to sign up, find an investment, and select a subscription plan. I also created a dashboard that allowed project stakeholders to see survey responses in real-time.
Outcome
As a result of this work, we delivered a full redesign of our onboarding that led to a 10% increase in customer satisfaction ratings and a 200% conversion increase to our target portfolio.